Biologists are trying to figure out what makes a cell unique in form and function. But they are not certain which components are key to making similar cells behave differently. Cold Spring Harbor Laboratory (CSHL) Associate Professor Jesse Gillis and his lab are tackling this problem with a new statistical method: they are analyzing the cell’s many components. Their technique is analogous to figuring out how a kitchen works by looking at a detailed list of all its component parts, including sinks, cabinets, screws, nails, and hinges, and comparing the components lists of millions of kitchens. With careful analysis, one can see which components are used in sets, which parts on the list are common to all kitchens, and which ones are unique only to some kitchens.
Gillis’ group developed a computer tool called MetaNeighbor to perform this task. The program uses RNA transcripts, which are copies of DNA that contain instructions on how to build proteins. Using statistical methods, the program figures out which sets of transcripts in what amounts are most significant to a cell’s function and identity. MetaNeighbor tracks hundreds of sets of transcripts to profile each cell’s function, then groups cells based on how similar their profiles are to each other.
MetaNeighbor: guilt by association
Maggie Crow, a former postdoc in Gillis’ lab, originally developed MetaNeighbor in 2018 to define a set of standardized parts for cells. The team is continuing to expand the tool. The program analyzes a portfolio of transcripts per cell to characterize its unique profile, known as a transcriptome. The transcriptome defines what is needed to build the cell’s anatomical features. The key is measuring the amount of each transcript.
For example, in the brain, neurons have protruding axons and dendrites that transmit signals (A). A cell with five times as many dendrites as another will have five times the amount of dendrite-related transcripts, in turn creating five times as many associated proteins (B).
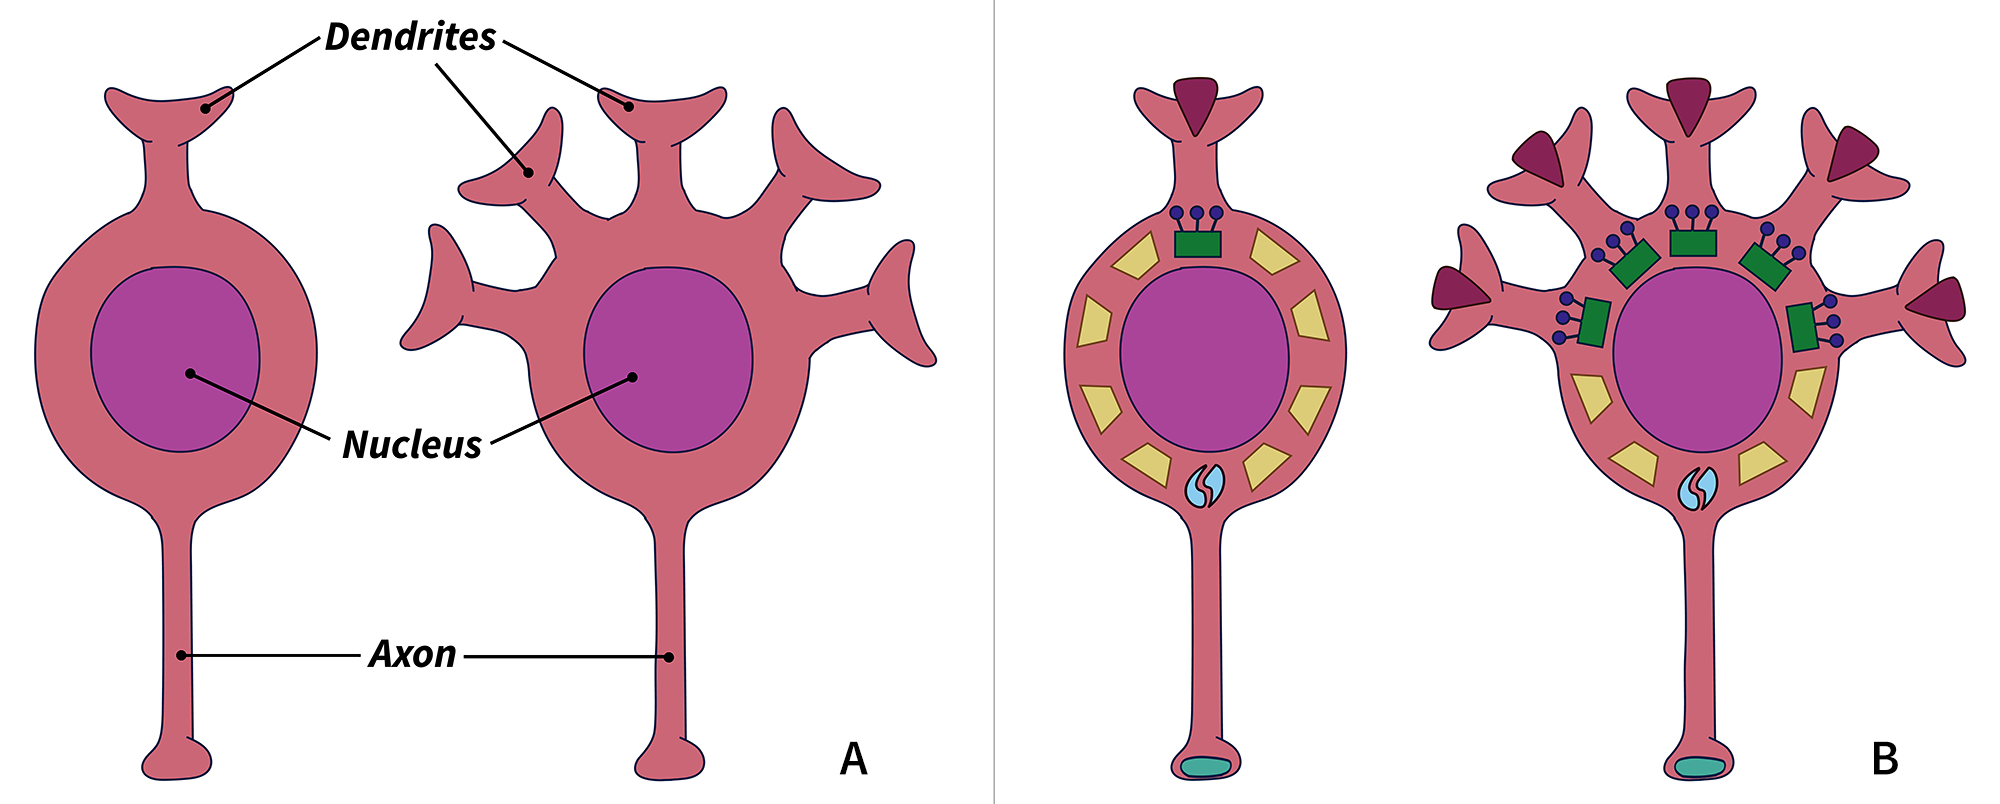
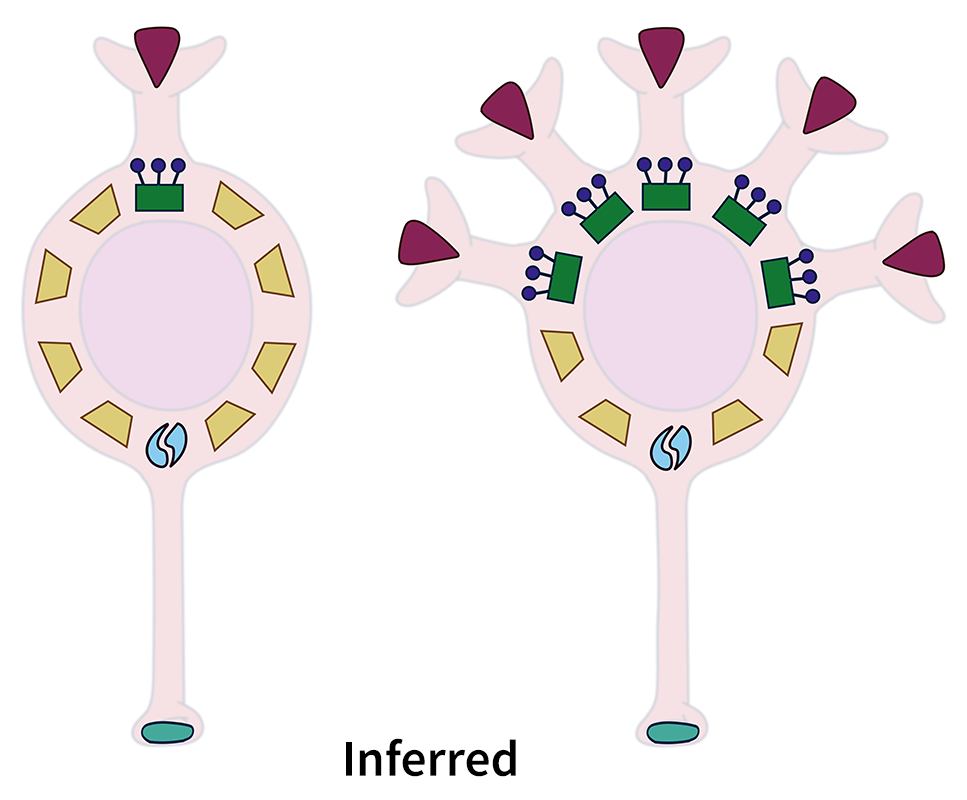
By looking at the pattern of transcript levels, scientists can infer what the cell probably looks like: a neuron with five times more transcripts related to building dendrites probably has five times as many dendrites. In some cases, they may also be able to infer the function. A cell with transcripts for a certain neurotransmitter receptor probably reacts to that neurotransmitter.
Ben Harris, a graduate student in Gillis’ lab, points out that the relationship between transcripts within each cell is key to how MetaNeighbor analyzes a transcriptome. When the transcripts are used in groups, one transcript is always present in the same ratio to another transcript, such as 3 to 1. Harris discovered that these ratios are intact across all cell types, whether the associated transcripts are being used at low or high levels, to build one dendrite or five dendrites.
Once MetaNeighbor establishes the ratios of transcripts to each other within a given cell, a statistical “guilt by association,” Gillis’ lab can collect large amounts of data from many different cells. The program can group together cells that have similar transcriptomes, and thereby similar functions and/or shapes.
From building blocks to the whole organism
The same types of screws, nails, and boards that are found in a kitchen could also be part of living room or bedroom furniture. Once scientists know the building blocks for one type of cell, they can figure out how the rest of an organism works using the same strategy.
Researchers that are part of the Brain Research through Advancing Innovative Neurotechnologies (BRAIN) Initiative – Cell Census Network (BICCN), funded by the National Institutes of Health, are using MetaNeighbor to categorize mammalian brain cells. The Network brings together many labs and computational scientists to create a standard reference set of brain cells for mice, primates, and humans. The advantage of MetaNeighbor is that it can group cells even if the methods of data collection vary. It can even combine data from different labs into one comprehensive data set.
Once MetaNeighbor establishes the ratios of transcripts to each other within a given cell, a statistical “guilt by association,” Gillis’ lab can collect large amounts of data from many different cells.”
MetaNeighbor is also helping scientists understand plants better, enabling them to design better and more sustainable crops. For example, Gillis collaborated with CSHL Professor David Jackson to create an anatomical map of the activity of key developmental genes in baby corn. Using Gillis’ methods, they tagged these genes to determine when and where they turn on and off as the corn grows.
Gillis also assisted in a study on tomatoes by CSHL Professor and Howard Hughes Medical Institute Investigator Zachary Lippman and CSHL Adjunct Associate Professor Michael Schatz. The researchers sequenced and distinguished genetic relationships between 100 tomato varieties, revealing 230,000 large-scale differences in DNA between them.
Squeaky hinges and loose screws
MetaNeighbor gives researchers better insight into what cells do, where they do it, and when they start or stop doing it. The program makes it possible to standardize research across labs. Armed with the right parts lists, researchers can map out how individuals differ within a species or how species differ from each other. Scientists can look for “loose screws” or “squeaky hinges” when comparing a new cell to a standard model. These standards and analysis tools will allow researchers to work with each other more easily and speed the pace of biological discovery.
Written by: Jasmine Lee, Content Developer/Communicator | publicaffairs@cshl.edu | 516-367-8845
About
Private: Jesse Gillis
Adjunct Professor
Ph.D., University of Toronto, 2007